Overview
Scientific visualization is complex.
Visualizations are commonplace in scientific practice. From conceptual understanding, to knowledge generation, to scientific communications, visualizations enable scientists to interrogate complex phenomena and convey scientific evidence that may not be observable in other ways.
Effective scientific visualizations are well-designed pieces that remain faithful to the science while addressing the communication needs of the audience. While smaller projects can be handled by a single scientific visualizer and their client (often a subject matter expert), larger endeavors may require a team of contributors with specialized knowledge and technical expertise. As teams expand and projects scale, it becomes increasingly important to establish a well-defined design process and clearly outline each contributor's roles and responsibilities. Gaps in understanding can lead to conflict between contributors, which can compromise the quality of the scientific visualization.
Defining the scientific visualization process.
We propose a framework that aims to define the design, production, and evaluation of scientific visualizations. This framework outlines the activities, outputs, contributors, bright spots (benefits), and pain points (challenges) observed at each step of the visualization process.
Applying a systematic framework to scientific visualization.
This toolkit introduces the framework and uses a case study to show how it is applied to a project. It aims to help practitioners make decisions about the visualization process when embarking on a new project. When used intentionally, it will facilitate conversations that allow their clients and contributors to better understand the impact of the design process on the final product.
Suggested Use
Using this toolkit, you will be able to:
Learn the key steps of our proposed scientific visualization framework
Understand the activities, outputs, bright spots, and pain points that occur at each step of the design process
Learn how to apply the framework template to projects
Scientific visualizers (practitioners or students-in-training) can use resources from this toolkit to navigate the design process with clients and team contributors - by facilitating alignment, fostering a shared understanding of the project, and addressing communication challenges.
Clients (who are seeking to work with visualizers) can also use this toolkit to gain insights into the process of creating a scientific visualization, enabling a better understanding of how ideas are transformed from conception to completion.
Materials
This toolkit includes:
-
Introduction to the Science Visualization Framework
-
Case Study
-
Framework Graphic (PDF)
-
Framework Templates (Word Doc)
This framework draws on an analysis of several conceptual frameworks [1-7] and the author team’s combined years of experiences in scientific visualization. While it was designed with good intentions, it is limited by:
-
Lack of validation in a real-world context
-
Generalizability - the framework will need to be tailored to the specific project
-
An investment of resources (time, money, expertise, etc.)
-
Intrinsic complexity of iterative design work, collaboration, and communication
Disclaimer
Share your thoughts and feedback for the Science Visualization Framework and this accompanying Toolkit using this Google Form. Your responses help us improve this resource for the visualization community. Thank you!
The Scientific Visualization Framework

The Scientific Visualization Framework is a systematic and iterative approach to communicating scientific concepts through static, animated, and interactive visual representations. The framework consists of 11 steps that takes an idea from conception to completion:
1. Orient
Phase 1: Pre-production
2. Research & Define
3. Ideate
4. Draft
5. Review
Phase 2: Production
6. Build
7. Compile
8. Review
Phase 3: Post-production
9. Refine
10. Deliver
11. Evaluate
The framework graphic also shows the skills required at each step of the project, as well as bright spots (positive experiences) and pain points (negative experiences) faced by the visualizer, client, and other collaborators throughout the project.
Science Visualization Framework Toolkit
Applying a systematic and iterative framework to the design, production, and evaluation of scientific visualizations
Case Study
Maya and Dr. Carbon conduct an initial briefing to align their visions and project requirements. They discuss Dr. Carbon's research goals, identify the target audience, and outline the desired impact of the visualization. Maya shares the ideal design process of their project with Dr. Carbon - this involves filling out and modifying the steps in the Framework template to suit the project's specific needs.
-
Bright Spot: By holding this meeting, Maya and Dr. Carbon strongly aligned on a vision for the project, fostering a sense of enthusiasm, rapport, and collaboration from the start!
-
Pain Point: Defining the project scope and requirements required multiple meetings and back-and-forth discussions. A fair amount of negotiation and client onboarding was required to ensure that the vision for the product was realistic within the desired timeline and resources.
-
Contributors: On a larger team, Maya would have brought on her project manager to mediate this meeting.
1. Orient: Initial Client Briefing
Gaining a shared vision and understanding of the project and its requirements at the outset is critical for the project's success. This involves engaging with all stakeholders and collaborators to ensure that everyone understands the project's objectives, scope, and timeline.
Maya solidified her understanding of this new science topic and its underlying mechanisms by consulting Dr. Carbon, studying scientific literature, and reviewing existing materials provided by Dr. Carbon and their research team.
-
Bright Spot: Maya gained a solid foundation of knowledge and understanding of the science to accurately capture it in her visualizations.
-
Pain Point: The vast amount of scientific literature and microscopy images required careful selection and analysis. Maya engaged Dr. Carbon for input (to help focus the scope of the content), but inconsistent communication delayed the project at this phase.
-
Contributors: At this stage, it may be a good idea for Maya to consult her target audience (other cell biologists) and work with another medical/scientific writer/researcher to research the content.
2. Research & Define
The pre-production phase is arguably the most critical phase in the development of a visualization project, where the groundwork for the project is laid out.
Phase 1: Pre-production
3. Ideate
Maya created multiple thumbnail sketches, experimenting with various visual styles and techniques to explore the best approaches for depicting the scientific topic.
-
Bright Spot: Maya's creative ideation and sketching phase allowed her to explore various visual styles and elements.
-
Pain Point: Staying true to scientific accuracy required careful consideration and refinement of initial concepts.
-
Contributors: Co-creating thumbnails with fellow designers and subject matter experts (in this case, the client).
It is important to generate as many different ideas and solutions as possible based on the problem statement formulated in either the first or second step. Keeping an open mind throughout the process and drawing inspiration from a range of sources can help generate a broad range of ideas and moderate productive discussions between visualizers, clients, and collaborators. It is also essential to involve a diverse group of collaborators in the design process to bring fresh perspectives and insights to the table.
4. Draft
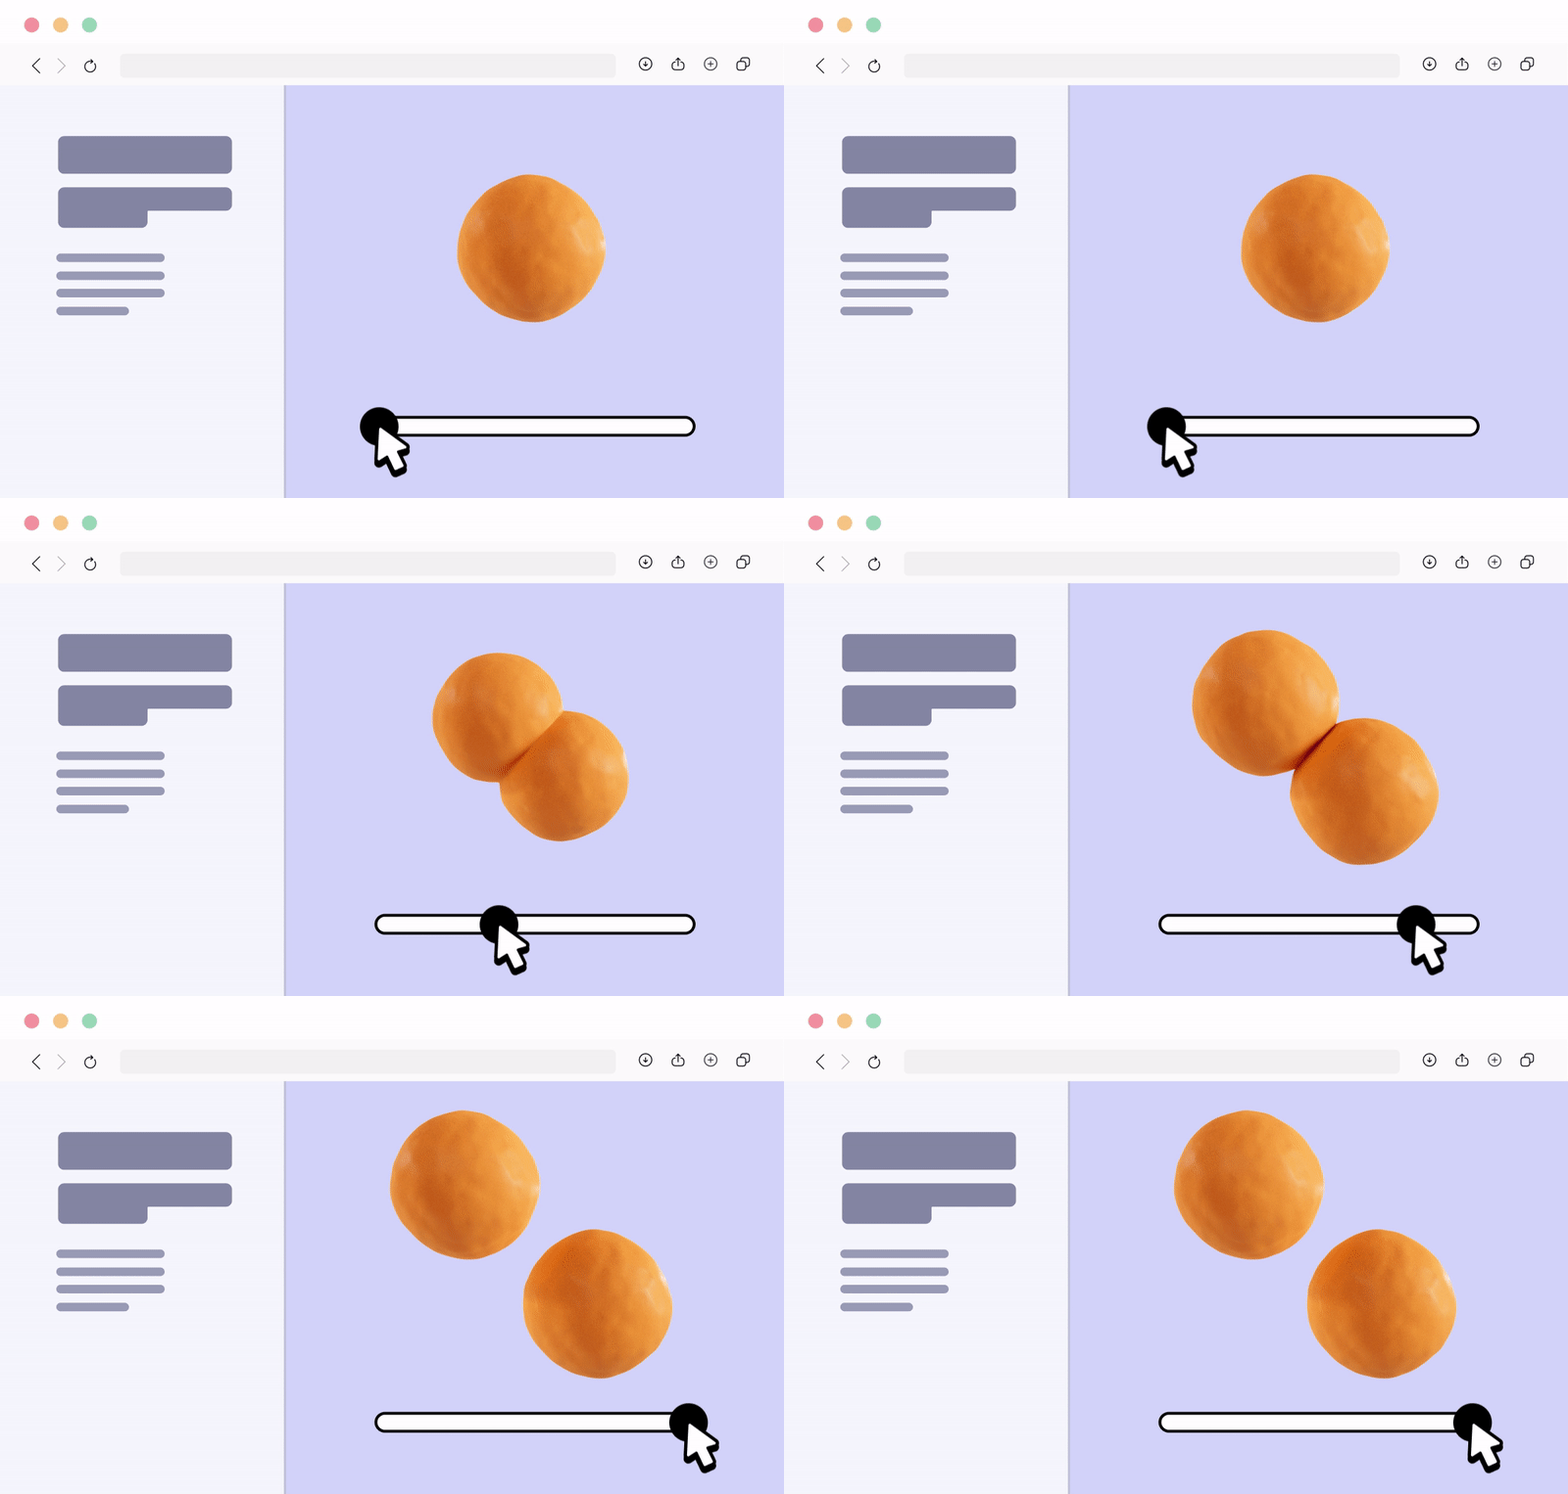
Maya refined her thumbnail sketches into drafts that captured the reversible nature of this new cell budding process. These could be comprehensive drafts of illustrations, storyboards for animations, and wireframes for an interactive webpage.
-
Bright Spot: Create material used to solicit meaningful feedback from collaborators and to guide production for internal team members.
-
Pain Point: Dr. Carbon may mistake drafts for final products rather than materials intended to collect feedback and critique. Reviewers may feel that their input is not needed if the draft is perceived as being too polished and complete, or too rough and incomprehensible
-
Contributors: Fellow designers.
In the draft step, it is important to refine ideas and sketches to a level of completeness that can elicit useful feedback from collaborators and users.
5. Review
Maya shared the drafts with the client, Dr. Carbon, to solicit his feedback and ensure that the sketches aligned with the project vision. She also asked Dr. Carbon to predict if target users, such as conference attendees, might react positively. Dr. Carbon annotates the sketches with his comments and solicits feedback from one of his colleagues as well.
-
Bright Spot: Gathering feedback from clients and professional peers allowed Maya and Dr. Carbon to ensure that the depiction of the scientific subject resonated well with the target audience.
-
Pain Point: Integrating and reconciling a variety of feedback required careful consideration, decision-making, and trust in the visualizer to execute the product.
-
Contributors: Fellow designers, project managers, clients, target audience, other collaborators (e.g., developers).
In the review step, it is essential to assess whether the prototype is fulfilling project requirements (e.g., effectively communicates the intended message, fulfils the needs of stakeholders, meets design standards such as accessibility and branding) by soliciting meaningful feedback from collaborators, reviewers, and users. In this step, one should carefully consider the feedback received and integrate it into future versions of the visualization.
Phase 2: Production
In this phase, the team uses a variety of software and draws from reliable data sources to build individual assets and components that make up the final visualization. The assets are then combined and integrated into a preview of the final product.
6. Build
After pre-production, the team moves on to building individual assets of the visualization. The team focuses on creating data-driven and scientifically informed assets that will be integrated into the final visualization (in many cases, where scientific data is lacking, a discussion about the visual treatment of more speculative features would occur in pre-production).
During the production stage, Maya creates assets for the visualization informed by scientific data. These may be illustrations and graphic design elements for a static conference figure, or 3D models and snippets of animations for a video presentation.
-
Bright Spot: Create visual interpretations informed by available scientific evidence and explore lighting, texturing, etc., and other stylistic decisions that could not be made in the pre-visualization stages
-
Pain Point: Technical issues, expected and unexpected, may arise due to a variety of reasons (lack of expertise, hardware issues, etc.)
-
Contributors: Fellow designers, subject matter experts, developers
7. Compile
During this step, the team assembles assets created in the previous phase to produce a preview - a work-in-progress - of the final visualization.
Maya roughly compiled the individual assets, arranging them to represent the sequence of events during reversible cell budding. This could be another comprehensive draft of an illustration, a playblast of an animation, or a product demo of the interactive media.
-
Bright Spot: Stringing assets together allows Maya, as well as her client, to preview the final product. Maya may decide to change certain assets or change the direction of the project if the preview did not meet project goals.
-
Pain Point: Similar to Step 4 Draft, the fidelity and level of completeness of the preview may affect the feedback Maya receives from her client and other collaborators.
-
Contributors: Fellow designers, developers.
8. Review
Maya and Dr. Carbon conduct another review of the work together, similar to in Step 5. They may focus their feedback on the more technical or aesthetic aspects of the project, now that they are past the ideation and conception phase.
-
Bright Spot: This is an opportunity for collaborators, clients, users to communicate expectations with one another and achieve alignment before they deliver the final product.
-
Pain Point: The team may not have enough resources, such as time, finances, and expertise, to carry out the review. If the project team does not review the preview seriously or thoroughly, they may miss an opportunity to address issues when the project is still editable.
-
Possible contributors: Fellow designers, project managers, clients, target audience, other collaborators (e.g., developers).
Phase 3: Post-production
Post-production is the final phase of the visualization process. It involves refining the final product, delivering it to the client, and evaluating whether it has successfully met its project requirements. During this period of low editability, any major feedback that surfaces may potentially lead to last-minute changes, changes in direction, frustration, and an increase in deadline and resource-related pressures.
9. Refine
During the refine step, the team adds finishing touches to the final visualization that tie together all assets generated during production. The team will undergo a final round of review to verify all aspects of the visualization (e.g., ensure the science has been accurately conveyed; ensure the visualization meets existing design standards in the problem space; etc.).
Maya integrates the feedback she received from the last round of review. She focuses on fine-tuning and polishing the visualizations to professional standards. This is a final opportunity to ensure the project is on the right track and meeting its requirements.
10. Deliver
Once the final product has been thoroughly polished, reviewed, and approved, it can be delivered to the client.
Maya packages the final visualization, following the project's dissemination requirements that she and Dr. Carbon specified at the beginning of the project. Accompanying documentation (e.g., design documents, references) is included to provide additional context for the client and other users of the visualization.
-
Bright Spot: Organized and comprehensive documentation allows Maya to properly archive this project. It also allows Carbon to share details of this project with others as necessary.
-
Pain Point: There may be difficulty wrapping up a project if Maya and Dr. Carbon did not clearly agree on project requirements at the early stages of the project.
-
Contributors: Project manager, client, developer, other collaborators.
11. Evaluate
In this final step, we may assess (informally or formally) – with the intended audience of the visualization – whether the final product has actually fulfilled the project requirements defined at the start of the project. This is an opportunity to reflect on the project as a whole and identify areas for improvement in future projects.
After delivering the visualization, Dr. Carbon may decide to informally evaluate its impact by using it in presentations with professional peers.
-
Bright Spot: Assessing the visualization's impact and effectiveness helps Dr. Carbon as well as Maya identify areas where the project went well and areas for future improvement.
-
Pain Point: Lack of available resources to conduct an informal or formal evaluation, such as lack of budget, time, and limited access to the target audience. The team may also not see value or reason in evaluating the visualization after its completion.
-
Contributors: Client, Evaluators, Subject matter experts, Target audience.
This case study explores the collaborative project between the scientific visualizer, Maya, and her client, cell biologist Dr. Carbon. The objective is to create an engaging scientific visualization that effectively communicates a new reversible cell budding process* (*not a real scientific phenomenon) for a conference presentation.
By following the steps of the science visualization framework, Maya and Dr. Carbon successfully communicate this scientific process through visually engaging multimedia, facilitating a deeper understanding and appreciation of reversible cell budding.
In this step, it is important to gain a deep understanding of the project's content and context of use, rather than making assumptions. This involves collecting insights about the subject matter, knowledge gaps, and barriers, as well as building a comprehensive understanding of the needs of the target audience within the problem space. This may include defining or redefining the project requirements based on insights gleaned from research.
References
-
Branch RM (2010) Instructional design: The addie approach. Springer, New York, NY
-
Christiansen J (2023) Building science graphics: An illustrated guide to communicating science through diagrams and visualizations. AK Peters/CRC Press, Boca Raton, FL
-
Design Council (2019) Framework for Innovation: Design Council’s evolved Double Diamond. https://www.designcouncil.org.uk/our-work/skills-learning/tools-frameworks/framework-for-innovation-design-councils-evolved-double-diamond/. Accessed 28 Oct 2022
-
Dick W, Carey L (1978) The systematic design of instruction. Scott, Foresman, and Company Glenview, IL
-
Graham ID, Logan J, Harrison MB, et al (2006) Lost in knowledge translation: Time for a map? Journal of Continuing Education in the Health Professions 26:13–24. doi: 10.1002/chp.47
-
Jantzen SG, Jenkinson J, McGill GG (2015) Transparency in film: Increasing credibility of scientific animation using citation. Nature Methods 12:293–297. doi: 10.1038/nmeth.3334
-
Stanford d. School (2010) An introduction to design thinking PROCESS GUIDE. Hasso Plattner Institute of Design at Stanford University. Available via Michael Shanks. https://web.stanford.edu/~mshanks/MichaelShanks/files/509554.pdf. Accessed 27 Oct 2022
Share your thoughts and feedback for the Science Visualization Framework and this accompanying Toolkit using this Google Form. Your responses help us improve this resource for the visualization community. Thank you!


